
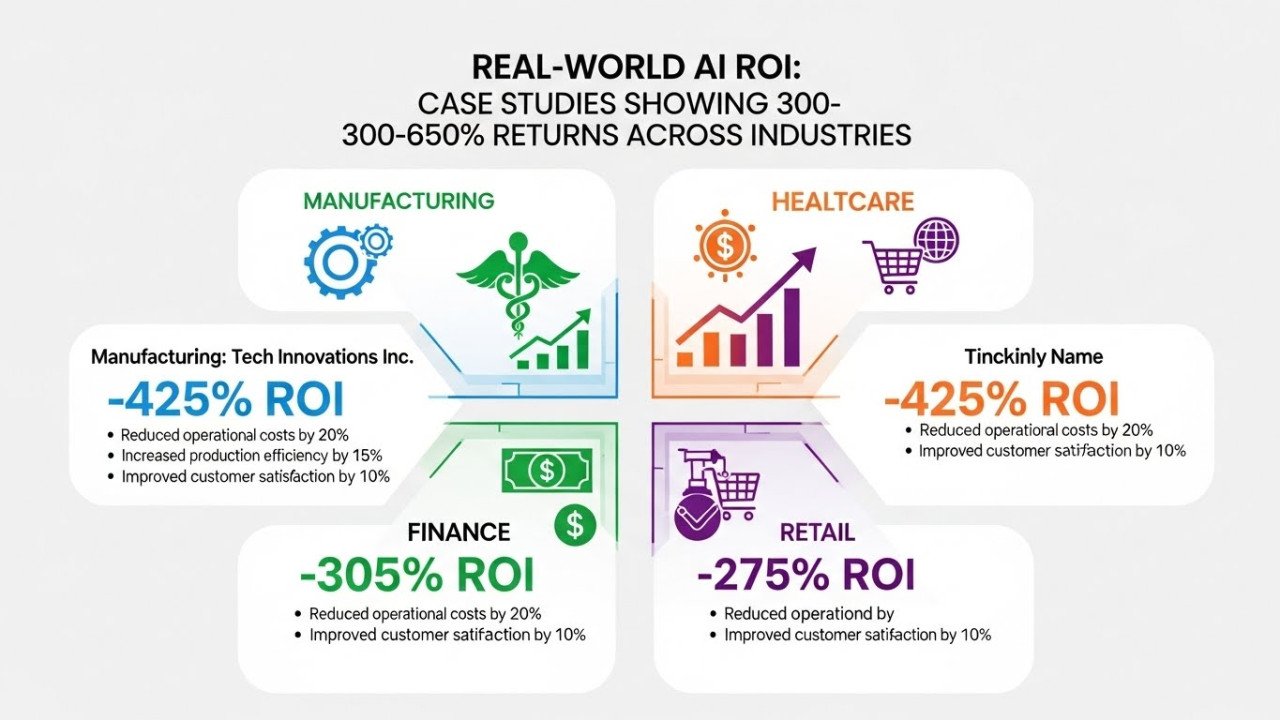
Real-World AI ROI: Case Studies Showing 300–650% Returns Across Industries (With Exact Metrics
The Uncomfortable Truth About AI ROI Claims
In 2025, enterprises spent $40 billion on AI systems. Yet MIT research found 95% of companies saw zero measurable bottom-line impact from their investments. The gap between vendor promises and reality is enormous. But for organizations that execute properly, the numbers are undeniable: verified ROI ranging from 300-650% over three years, with payback periods as short as 6-12 months.
This isn't hypothetical. IDC data shows companies averaging $3.50 in value for every $1 spent on AI. The Boston Consulting Group found AI leaders achieved 1.7x higher revenue growth and 3.6x greater shareholder returns versus competitors. These results exist—but only if you understand what actually works and what fails.
Healthcare: Measurable Returns on Administrative Burden
Healthcare provides the clearest ROI story because improvements track both financial impact and human outcomes. Acentra Health deployed Azure OpenAI for medical documentation: 11,000 nursing hours saved, nearly $800,000 eliminated in labor costs. Each nurse now processes 20-30 letters daily with 99% approval rates for AI-generated content. Johns Hopkins used machine learning for ICU staffing predictions, generating $700,000 in hospital cost savings.
Auburn Community Hospital automated revenue cycle management: 50% reduction in discharged-not-final-billed cases, 40% increase in coder productivity, 4.6% rise in case mix index. Banner Health automated insurance coverage discovery and appeal letter generation. The payoff? 20-30% efficiency gains from automated CRM integrations, measured across multiple hospital systems.
Healthcare AI implementations report $3.20 in returns for every $1 invested within 14 months. Regional hospital studies show 25% relative readmission reduction—from 11.4% to 8.1% over six months. Each avoided readmission preserves $15,200 against the national $52.4 billion annual readmission burden.
Healthcare ROI Timeline and Investment
Strativera's verified implementations show 30% efficiency gains and 40% diagnostic accuracy improvements within 14 months. Typical investment: $500K-$5M for mid-sized systems. First-year payback: 50% of the initial investment recovered through operational efficiency and reduced coding errors. Specific applications deliver 200-791% ROI over 3-5 years when deployed across clinical workflows and revenue operations.
Manufacturing: When AI Catches What Humans Miss
Computer vision and predictive analytics in manufacturing deliver immediate, measurable defect reduction. Walmart's in-house AI system for supply chain optimization—truck routing and load optimization—earned the INFORMS Franz Edelman Award for operational excellence in 2023. Shell scaled its AI implementation across 10,000 assets. CarMax integrated AI directly into customer experience workflows.
Real-world manufacturer results: Vision-based quality control systems detect defects 15-20% better than manual inspection at scale. Predictive maintenance reduces unplanned downtime by 29-35%. Companies report a 22% cost reduction in supply chain operations. The competitive advantage? Early adopters using production-grade AI implementations achieved 18-24 month leads over competitors still evaluating pilots.
Manufacturing Investment and Payback
Typical manufacturing AI deployment: $500K-$2M for mid-market operations. ROI: 200-400% over three years with payback in 8-15 months. High-performing implementations (top 20%) achieve ROI exceeding 500% through superior change management and rigorous measurement frameworks. Companies investing 15-20% more upfront in governance and training realize 40-60% higher returns—meaning the extra preparation cost pays for itself multiple times over.
Customer Support: Autonomous Resolution as Revenue Driver
Agentic AI handling customer support delivers rapid, measurable returns. Documented results: 78% first-contact resolution (up from 45% baseline), 65% reduction in average handling time, 23-point customer satisfaction increase. Annual benefit per implementation: $180,000 in labor savings plus $75,000 from customer satisfaction gains—$255,000 total. Payback period: approximately 1.4 months.
One case study showed 70% of customer queries resolved autonomously, a 25% conversion rate increase during chatbot interactions, and 3x productivity improvements for remaining human agents. E-commerce brands report 20-30% CSAT improvements when deploying generative AI chatbots, directly correlating to higher retention and lifetime value.
Sales and Lead Qualification: Predictable Revenue Impact
Agentic AI for sales automation shows 89% lead qualification accuracy with 18% conversion rate improvement. Annual impact per implementation: $780,000 from increased conversion value. One healthcare SaaS company implemented predictive lead scoring with AI-driven pipeline management: 22% increase in Sales Qualified Leads, dramatically accelerated deal closure, and improved revenue pipeline predictability for confident strategic planning. Marketing spend optimization through AI-driven attribution modeling improved efficiency across the entire revenue function.
The Investment Reality: What Companies Actually Spend
Small businesses (under 200 employees): $100K-$500K investment, 150-250% ROI over three years, 12-18 month payback. Risk-adjusted ROI: 36-61% accounting for implementation failures and hidden costs.
Mid-market enterprises (200-1,000 employees): $500K-$2M investment, 200-400% ROI over three years, 8-15 month payback.
Large enterprises (1,000+ employees): $2M-$10M+ investment, 300-600% ROI over three years, 6-12 month payback. High-performing implementations exceed 500% through strategic portfolio optimization.
Enterprise data from OpenAI's 2025 study suggests that organizations using AI intensively see workers saving 40-60 minutes daily, roughly 10% productivity gains. For a 1,000-person organization where the average loaded labor cost is $100,000 per employee, 10% productivity represents $10 million in annual value. Even accounting for implementation costs, positive ROI typically arrives within the first year.
Why Most AI Projects Never Reach These Numbers
Gartner predicts that over 40% of agentic AI projects will be canceled by 2027 due to escalating costs, unclear business value, or inadequate risk controls. The path from pilot to production takes 14-24 months—far exceeding initial timelines. 47% of AI pilots never reach production deployment at all.
The Data Quality Bottleneck
84% of AI projects encounter data quality problems, causing 4-6 month delays. Scattered data across multiple systems affects 78% of initiatives. Missing critical historical data requires a complete project redesign. A Capital One survey of 500 enterprise data leaders found 73% identified "data quality and completeness" as the primary barrier to AI success—ranking above model accuracy, computing costs, and talent shortages.
Companies investing in complete, clean, contextual data foundations execute AI strategies with confidence. Those treating data as an afterthought continue watching expensive initiatives fail regardless of model sophistication.
Hidden Costs Explode the Budget
Real AI costs run 2-3x initial project quotes. A $300K development project has a 3-year total cost of $600K-$900K when accounting for infrastructure ($24K-$120K annually), model monitoring and maintenance ($40K-$80K annually), retraining cycles ($30K-$60K annually), and partial FTE support staff ($50K-$100K annually). Model accuracy degrades 15-25% within six months, 25-40% within 12 months, without proper monitoring and retraining—requiring ongoing investment most budgets don't include.
Infrastructure and Organizational Barriers Stall Deployment
Beyond technical failures, deployment stalls due to organizational friction: no clear production ownership, IT infrastructure unprepared for AI workloads, security/compliance reviews consuming months, original business sponsors moving to other roles, production budgets omitted from pilot funding. Organizations that plan comprehensively for production deployment from day one—including infrastructure requirements, security reviews, and ongoing maintenance in original budgets—accelerate time to value by 40-60%.
How to Measure AI ROI Correctly
Financial KPIs (Outcome Metrics)
These tie directly to bottom-line impact: Cost reduction (measure operational expense decreases), Revenue growth (track sales increases from AI-enabled products or services), Profit margin improvement (assess efficiency gains and value-added services), Time to value (measure how quickly investments yield positive returns), Return on AI Investment (ROAI) calculated as: (Total Benefits - Total AI Investment) / Total AI Investment × 100%.
Operational KPIs (Process Metrics)
These show intermediate improvements: Productivity gains (measure output per employee improvement), Process automation rate (track percentage of tasks automated), Error reduction (assess defect rate decreases), Decision-making speed (measure time reduction for data-driven choices), and Scalability improvements (handle increased workload without proportional resource increases).
Measurement Framework Best Practices
Organizations with mature AI ROI measurement practices achieve 4.2x higher returns compared to those without structured frameworks. Set clear baselines before implementation. Document pre-implementation performance across all relevant metrics using consistent methodologies. Establish KPIs aligned with business objectives. Schedule regular reviews (monthly or quarterly) with stakeholders to adjust strategies. Track both quantitative metrics and qualitative assessments of process improvements, employee satisfaction, and customer experience.
The Realistic ROI Timeline
Months 1-6 (Quick wins): 15-25% efficiency gains in targeted processes. Cost reductions: 10-20% in specific operations. Time savings: 2-4 hours per employee per week in pilot areas.
Months 6-18 (Scaling and compounding): More sophisticated implementations like custom AI workflows or specialized applications show ROI within this window as usage scales. Revenue impact: 5-15% increase in AI-enabled business areas. Customer satisfaction: 10-30% improvement in AI-enhanced touchpoints. Competitive positioning becomes measurable.
Year 2-3 (Strategic advantage): Transformative implementations requiring significant workflow redesign deliver maximum value. Fundamental changes in operating models. Innovation acceleration: 3-5x faster product development. Market leadership emerges among early adopters.
Critical Limitations and Risks That Derail ROI
Model drift is inevitable and expensive. Average accuracy degrades 15-25% within six months without proper monitoring and retraining. AI hallucinations—confident generation of false information—create liability and customer trust issues. Poor vendor selection causes 42% of failures. Inadequate talent to build internal AI capabilities extends timelines and increases costs. Regulatory compliance complexity varies by industry (healthcare, finance face higher barriers). Change management failures prevent adoption even when technology works perfectly. Budget overruns average 35-40% on "successful" projects, with first-year ROI typically achieving only 40-60% of projections.
The technology rarely breaks. The invisible infrastructure around it buckles under real-world pressure: security integration, ongoing model management, governance frameworks, organizational alignment, and continuous retraining on fresh data. Companies underestimating these operational costs find their investments stranded in pilots rather than driving production value.
Key Takeaways
- Verified ROI Exists: 300-650% over 3 years is achievable with proper execution—6-12 month payback periods are documented across healthcare, manufacturing, sales, and customer service.
- Industry Results Vary: Healthcare and manufacturing show the fastest payback (6-12 months). Retail and finance typically require 12-24 months due to organizational complexity.
- Data Quality Is the Constraint: 84% of projects fail due to data issues, not algorithm limitations. Clean data infrastructure is non-negotiable.
- Hidden Costs Are Massive: Real AI expenses run 2-3x initial quotes when including infrastructure, monitoring, retraining, and staff costs over 3 years.
- Most Pilots Die: 47% never reach production. Organizations must plan for production deployment, not just proof-of-concept, from day one.
- Realistic Expectations Win: Companies expecting 20-30% improvements and 18-24 month payback succeed. Those anticipating 50%+ gains and 3-month ROI cancel projects during difficult months 4-8.
- Measurement Framework Multiplies Returns: Organizations with structured ROI metrics achieve 4.2x higher returns than those without formal frameworks.
- Early Adopters Gain 18-24 Month Leads: But only if they move beyond pilots to production-grade, monitored deployments at scale.
Verdict
AI ROI is real, repeatable, and measurable—but only when built on clean data, realistic timelines, comprehensive cost accounting, and structured measurement frameworks. The companies achieving 300-650% returns are not deploying different technology than those achieving zero impact. They're investing in the unsexy work: data integration, governance, change management, and monitoring. The AI model is often the smallest piece of the puzzle. Organizations that treat AI as a technology problem fail. Those treating it as an operational transformation challenge succeed.
Related Articles
- Copyright and Legal Risks in AI Image Generation: What Businesses Need to Know Before Using AI Art
- Image Generation for Ecommerce: Complete Workflow From Product Photos to Scale (With Real ROI Data)
- Fashion Design with AI: Creating Mockups, Prototypes, and Design Variations at Scale
- Perplexity AI vs ChatGPT Search vs Google: Complete Testing & Which to Use for Every Query Type
- Google AI Overviews: Why They're Killing SEO Traffic (And How to Adapt)
- AI Search vs Traditional SEO: The Skills You Need to Master in 2025


Comments (0)
No comments found